Michigan Sportsman Forum banner
  • From treestands to ground blinds, all your hunting must-haves can be found at Bass Pro Shops. Shop Now.

    Advertisement

Hunter retention comparison of 5 UP DMU's

9.1K views 88 replies 30 participants last post by  standsetter  
#1 ·
In regards to some of the claims that LPDMI is making in terms of hunter retention, linking it to APR's, some further analysis is worthwhile.

In the video on their website, hunter retention rates in DMU 122 are compared to those in 3 other UP DMU's, DMU's 152, 155 & 252. Those three DMU's had previously had the same APR's as DMU 122 but they were not renewed after 5 years, while the ones in DMU 122 were. The comparison then shows further changes in hunter numbers that have occurred since APR's were dropped in those 3 DMU's and continued in 122. Clearly, the implication is that the removal of APR's in those 3 counties caused hunter numbers to tank and that the continuation of APR's in DMU 122 is responsible for an increase in hunter numbers there. The primary problem with this is that during the period that Bio has lumped together in the 3 DMU's post APR's, there were two different sets of regulations in effect. In addition, it ignores what happend in regards to hunter numbers in those DMU's, during the 5 years that APR's were in place.

In order to make a reasonable assessment of any potential impact that APR's may have, you have to examine and differentiate between the different regulations that were in place during all of the periods that we have data for.

One way to do that is to look at what the average annual increase/decrease in hunters was in each DMU and contrast them on the basis of the regulations that were in place during those time periods. That will give us a sense of whether there is a clear and obvious impact resulting from specific regulations or whether changes in hunter numbers may be due to some other factors.

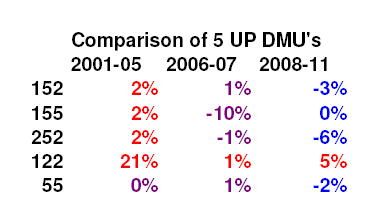
This chart compares 5 UP DMU's during three periods between 2001 and 2011. The regulations in effect in each DMU are color-coded. Red = 3 pt. APR, Purple = no APR and Blue = HC APR's.

Image


In looking at these numbers, a few things stand out. During the 1st time period, 4 of the 5 DMU's had APR's but clearly something other then just APR's was spurring increased numbers of hunters in DMU 122 or else something else was causing hunter numbers in the other 3 APR dmu's to show substantially lower rates of growth. Comparing the non-APR DMU to 3 of the 4 APR DMU's does not show a very significant difference that could be attributed to APR's.

During the second time period, 3 of the 4 non-APR DMU's showed comparable levels of retention, as did the APR DMU and one non-APR DMU took a big hit in hunter numbers. Hard to point to the presence or absence of APR's as being the causative factors for any of those numbers.

The third time period compares 4 DMU's under HC APR's to DMU 122 which had a 3 pt. APR. 3 of the HC DMU's showed modest hunter loss, 1 was static and DMU 122 showed modest gains. In looking at those figures in a vacuum, one might attribute the modest gain in DMU 122 to the fact that it had APR's or you might conclude that HC APR's cause some hunter loss. But given the fact that DMU 122 showed substantially higher gains during the time period when 3 of the other DMU's also had APR's, it would be easy to conclude that some other factor is driving hunter retention/increases in DMU 122 that has nothing at all to do with APR regulations.

I'll give Bio credit for a slick video presentation but the implied conclusion that is being drawn from the data he provides is, in my opinion, a bogus one. Again, it's a shame that LPDMI has to try and fabricate reasons for people to support what they are selling.
 
#2 ·
What is the denominator you are using for these percentages? Without stating what years are in both the numerator and denominator we have no idea what you are talking about.

In my case I clearly stated what years I was using for numerators and denominators. The numerator was the years 2006-11, and the denominators were 2001-05. Here is a quote from my letter to the NRC:

We examined all of these DMUs during the years 2006 to 2011 and compared average hunter numbers then to the years 2001 through 2005, when antler point restrictions were in place in all four DMUs. The results were surprising. Hunter numbers in DMU 122 increased by 24%. At the same time hunter participation decreased by 8% in DMU 152, by 17% in DMU 155, and by 18% in DMU 252.
DMU 122 up 24%
DMU 152 down 8%
DMU 155 down 17%
DMU 252 down 18%

All you have there is a bunch of colored numbers unless we know how you calculated them.
 
#3 ·
I don't get all worked up over hunter retention or how it is sustained or not or why, but in a but shell hasn't almost every dmu in the state lost hunters? I believe that is a yes. How do the DMUs who have aprs compare? From what I have seen they fair better. Why? I don't know. Could be a coincidence, could be the number of deer, could be anterless opportunity, could be just a abnormal occurance. Or it could be aprs have made hunters happy enough to stay. If you looked at a map of Michigan and all its DMUs showing a gain or loss of hunters, a very large portion of them will show a loss and very few would show a gain or sustained numbers, just so happens some that are better than others have aprs.

Sent from my Nexus 7 using Ohub Campfire mobile app
 
#5 ·
What is the denominator you are using for these percentages? Without stating what years are in both the numerator and denominator we have no idea what you are talking about.

In my case I clearly stated what years I was using for numerators and denominators. The numerator was the years 2006-11, and the denominators were 2001-05. Here is a quote from my letter to the NRC:


DMU 122 up 24%
DMU 152 down 8%
DMU 155 down 17%
DMU 252 down 18%

All you have there is a bunch of colored numbers unless we know how you calculated them.
I already described what those numbers represent, the average annual change in hunter numbers for each DMU during the periods indicated in each of the three columns. That average is derived by comparing the hunter numbers for each year compared to the previous year and measuring the percentage of change of those hunter numbers annually. The percentage of annual change is then averaged over the time period noted.

Thank you for confirming that your numerator combines time periods when two different sets of regulations were in place in 3 of the 4 DMU's that you were comparing. In layman's terms, that's called "Junk" science. ;)
 
#6 ·
Even using your chart dmu 122 has had aprs the entire length of the years you chose. Again looking at your chart, dmu 122 is the only one that does not have a negative and the only dmu that still has aprs
Very observant, yes DMU 122 has had APR's during the entire time period from 2001 to 2011.

You are also correct that DMU 122 has not lost hunters and is the only DMU that still has a 3 pt. APR.

The question is, is that because of the APR's or is it because of some other factor. If it's because of APR's, then during the first time period (2001-2005) why did DMU 122 show an average of a 21% increase in hunters annually, while the other three DMU's that had APR's had an annual increase of 2%? Same APR yet dramatically different results. Still want to attribute that difference to APR's?

During the second time period, DMU 122 had almost identical retention/recruitment rates to 3 of the other DMU's compared, despite the fact that they didn't have ANY APR's. Still want to attribute any difference to APR's?

During the 3 time period, when the other 4 DMU's all had HC APR's, you are correct DMU 122 showed recruitment when the others did not but during previous time periods there were other instances when DMU 122 also showed significantly higher levels of recruitment, even when 3 of the other DMU's also had APR's. Kind of arbitrary to attribute the difference to APR's in one case, when it pretty clearly was not the causitive factor in the other.
 
#7 ·
I just showed your graph to 4 different people without interjection on my behalf and every single person said that APRs were undoubtedly the driving force behind hunter retention...they also pointed out that its possible that something else could be at play due to the large jump in 122 but since you don't know what it is and can't contribute it to anything, APRs are the only logical explanation...thanks for lending the LPDMI a hand! :thumbup:
 
#8 ·
I just showed your graph to 4 different people without interjection on my behalf and every single person said that APRs were undoubtedly the driving force behind hunter retention...they also pointed out that its possible that something else could be at play due to the large jump in 122 but since you don't know what it is and can't contribute it to anything, APRs are the only logical explanation...thanks for lending the LPDMI a hand! :thumbup:
LOL! Yep, thanks for the......:help:
 
#9 ·
Again what stands out is the counties with aprs have better retention than almost every other dmu. Can we say aprs are the driving force? No but we can't ignore it either. It is definitely something that should be looked at much further and by people without any interest in aprs or opposing them.

Sent from my Nexus 7 using Ohub Campfire mobile app
 
#10 · (Edited)
I already described what those numbers represent, the average annual change in hunter numbers for each DMU during the periods indicated in each of the three columns. That average is derived by comparing the hunter numbers for each year compared to the previous year and measuring the percentage of change of those hunter numbers annually. The percentage of annual change is then averaged over the time period noted.

Thank you for confirming that your numerator combines time periods when two different sets of regulations were in place in 3 of the 4 DMU's that you were comparing. In layman's terms, that's called "Junk" science. ;)
Anyone can look at all the data charted out and see that only one of these DMUs is gaining hunters over the period of their existence (since 2001).

Wow, look at DMU 152 (green line, bottom panel). Notice how it started out higher than 122 and now is lower? In fact, during the years 2001-04, DMU 252 averaged 45% more hunters than DMU 122, during the last 4 seasons it averaged 23% fewer hunters than DMU 122. Do you really want to scramble numbers around and make it look like this isn't happening?

Image


I think the only thing more outrageous than the manner in which you are assessing this data is the insulting manner in which you present it.

Nonetheless, you have figured out a way to use a meaningless analysis to scramble up a bunch of colored numbers and present them as if they have meaning, while hurling insults and accusations, in the hopes that you will convince people who cannot simply look at the charts and see what is dead obvious.

It is perfectly reasonable to look at the years after mandatory APRs were discontinued in the 3 DMUs in comparison to DMU 122. They were all under identical regulations during the 6 year period since 2006 and all can be contrasted with DMU 122. Below is a chart showing, for each DMU, the 5 years of MAPRs (red) vs. the 5 years after (blue). DMU 152 (upper left) was declining slightly during the APR years (red) and has continued to decline since (blue). DMU 155 (upper right) was relatively stable during the APR years (red) and has declined substantially since then (blue). DMU 252 was rising slightly during the APR years (red) and has declined over the last 6 years (blue). DMU 122 was rising during the APR years (red) and is the only DMU of the 4 that is continuing to rise since then (blue). But the rising during the first 5 years of APRs is not very reliable considering the fact that there was extremely high year to year variability in that DMU. Facts are, in 3 of 4 of these DMUs, the trend was flat to rising during the APR years, and fell in all 3 DMUs that discounted APRs, while continuing to rise in the one DMU that kept them.

While that does not prove the case that APRs are causative of hunter recruitment, nothing you are presenting even remotely disproves the hypothesis. And that is all it has ever been presented as, a hypothesis. It would be a diservice to hunters to not see these striking data in two different regions of the state and not at least consider the possibility, that in these regions where hunters were over 70% in favor of keeping the regulations, that they might, just maybe, be more happy and more likely to continue hunting while all around them hunter numbers are falling under traditional management.

Image


You want to make something out of the 2 years between APRs and Hunter's Choice? Why? It is dead obvious that all of these DMUs that do not have mandatory APRs are trending down.

And please, don't tell me HC is a mandatory APR. It caused a huge shift in hunter license purchases, and has not, according to the DNR. resulted in effectively protecting young bucks. It is not a Mandatory APR. It is a Voluntary APR. The state of MI will no longer accept HC proposals from hunter groups because it is not an effective means to protect young bucks.
 
#11 ·
Anyone can look at all the data charted out and see that only one of these DMUs is gaining hunters over the period of their existence (since 2001).
More junk science graphs from Bio. :lol:

Your graphs are meaningless unless you differentiate between the regulations that were in effect in each DMU. For the first five years of those graphs all of the DMU's have the same regulations, so claiming that the trend in DMU 122 is attributable to APR's, while the trends in the other DMU's are not is simply crap.

Bioactive said:
You want to make something out of the 2 years between APRs and Hunter's Choice? Why? It is dead obvious that all of these DMUs that do not have mandatory APRs are trending down.
Make something of the fact that THE REGULATIONS CHANGED during those two years? Um, Duh! It's not dead obvious because not all of the DMU's trended down when the APR's were removed. Hunter numbers in DMU 252 ticked up after APR's were removed.

Bio said:
And please, don't tell me HC is a mandatory APR. It caused a huge shift in hunter license purchases, and has not, according to the DNR. resulted in effectively protecting young bucks. It is not a Mandatory APR. It is a Voluntary APR. The state of MI will no longer accept HC proposals from hunter groups because it is not an effective means to protect young bucks.
And please don't tell us that HC APR's are identical to not having any APR's in their potential impact on hunter retention because that is another load of crap.

If you don't like being criticized for trying to sell your APR's using junk science, then maybe you should stop doing so. Pretty simple solution. :lol:
 
#14 ·
Maybe we ought to have some of these graphs in the woods come Feb and March to show the deer how many has to survive this year :D. I was a hunter safety instructor for many years and one of the things that I noticed was in talking to the parents many had quit hunting for one reason or another. I was told the main reason their kids were there is because there were guns in the house and it was for a safety reasons. If these kids don't ever get involved into hunting of some sort we are going to continue to see the numbers keep sliding no matter what we do.
 
#15 ·
Losing hunters has absolutely nothing to do with APR's, wether they're in effect or not:lol:

Deer hunting isn't for everyone, most people cant sit in the woods and wait for a deer to come by, it is a very boring sport for most.

Unless you are born into it, or get hooked on it from going with someone that knows what they're doing, or you love extreme punishment, deer hunting is not gonna be your cup of tea.
 
#17 ·
To further illustrate the bogus nature of Bio's claims, let's examine changes between two of the DMU's that he used in his video during the three different periods of regulations.

Image


The same 3 pt. APR was in place in both of these DMU's during the time period in the first graph. No way to attribute any difference to APR's as they were identical in both DMU's during this time period.

Image


Then the APR's were removed in DMU 152 while they continued in DMU 122. No major difference between the two that could be attributed to APR's during the years that one had them and one didn't.

Image


Then HC-APR's were imposed in DMU 152 while the 3 pt. APR was continued in DMU 122. Bio would like you to believe that HC APR's are identical to not having any APR at all, using the ridiculous idea that the DNR could not determine a measurable difference in yearling protection rates, so therefore there would be no difference with hunter retention. You can draw your own conclusions whether HC-APR's reflect poorer hunter retention but whether they do or not has nothing to do with the comparison in hunter retention between APR and non-APR DMU's.

As previously mentioned, Bio has lumped non-APR and HC-APR time periods together in his comparisons, which is both intentionally misleading as well as being just plain bad science.
 
#20 ·
Now lets compare DMU 122 with another of the DMU's that Bio used in his video.

Image


Both DMU's have an identical APR during this time period.

Image


APR's removed in DMU 252 and hunter recruitment increases. APR's continue in DMU 122 and there is a slight drop in hunter numbers.

Image


HC - APR's implemented in DMU 252 and hunter numbers start to trend down under HC - APR's. APR's continue in DMU 122 and hunter retention remains flat.

I don't see any reasonable way that someone could look at the comparisons between these two DMU's during the different regulation periods and draw the rational conclusion that hunter retention is higher in a DMU with APR's then it is in a DMU without them. Yet Bio's video implies that there is a major difference in hunter retention between the two DMU's during these years and the clear implication is that it's due to the APR's in DMU 122. Completely misleading and bogus, just no other way to describe it.
 
#21 ·
You guys are forgetting to use cost of living in all of your calculations. What was the cost of beef, corn, a gallon of gas, or a quart of oil in 2001? Shouldn't unemployment figures should be added also? If your going back 13 years I would also include any trends in birthrates, death rates, marriage and divorce rates.
All of these could have just as much of an effect on hunter retention as any of your examples, maybe more.
 
#22 ·
"To further illustrate"

It is AMAZING that this topic is even a conversation as there is NO WAY to know how many hunters are in ANY DMU in the great U.P.!!!

Dave
 
#23 · (Edited by Moderator)
Flotsam and jetsam. Typical all-dayer M-S poster watching on, despite being 80 degrees and full sun/perfect day posting about an already decided regulation but can't let it go because somehow they based their entire self worth on attaching it to a tweeking of 3" going to 3pt on one side has consumed their entire lives and existence.
 
#26 · (Edited)
Continuing with the comparison of DMU 122 to the third DMU that Bio used in his video.

Image


During the time period of this graph, both DMU's had identical 3 pt. APR's., yet DMU 155 was trending slightly down during this period while hunter recruitment in DMU 122 was trending upwards. Were the APR's causing the upward or the downwards trend? Both? or Neither.

Image


Then the APR's were removed in DMU 155 while they continued in DMU 122. The slightly downward trend continued in DMU 155, as it had under APR's while DMU 122 changed from an upward trend to a slightly downward trend, despite there being no change in the APR's in that DMU.

Image


Then HC - APR's were put in place in DMU 155 while the 3 pt. APR's continued in DMU 122. Pretty similar trends in both DMU's despite being under different regulations.

In objectively comparing these two DMU's, one would note that DMU 122 outperformed DMU 155 during the period that both DMU's were subjected to identical APR's and that the slight difference in recruitment between the two DMU's continued, regardless of the what regulations were put in place in DMU 155. There is no evidence based on the comparison of hunter numbers between these two DMU's that APR's played any kind of a role in differences in hunter retention or recruitment.